
NHS Birmingham CrossCity Clinical Commissioning Group - Annual Report Design
Infographic-led annual report design and animation for NHS Birmingham CrossCity Clinical Commissioning Group, transforming complex organisational information into a clear, engaging and visually accessible communication piece.
Annual Report Design
Creative direction | Infographic design | Information visualisation | Editorial design | Motion graphics | Accessible communications
My role
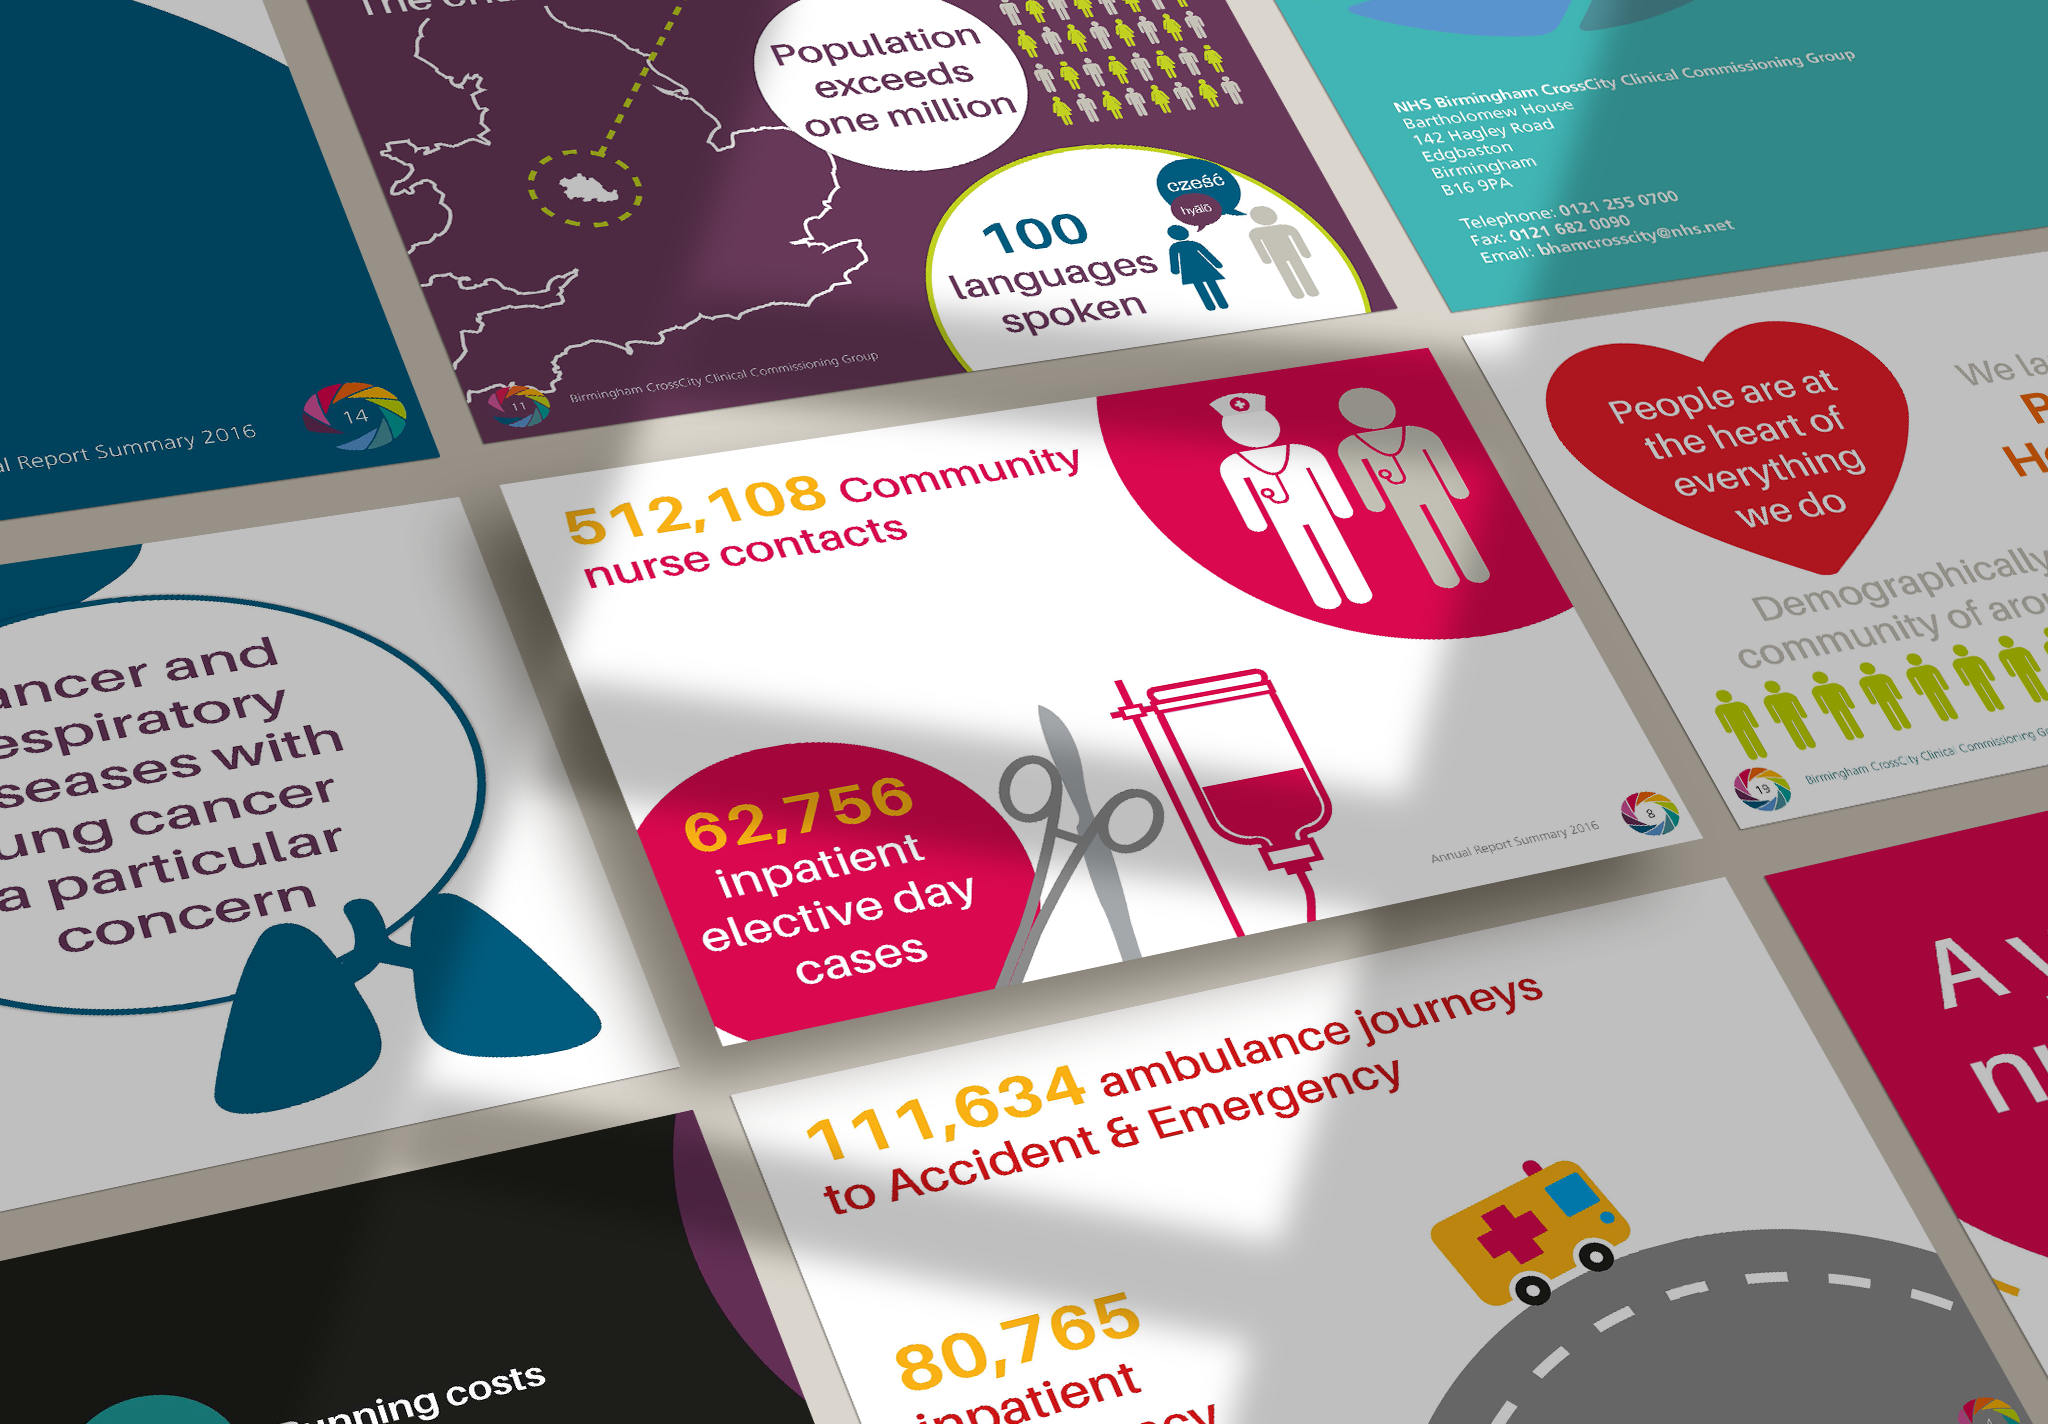
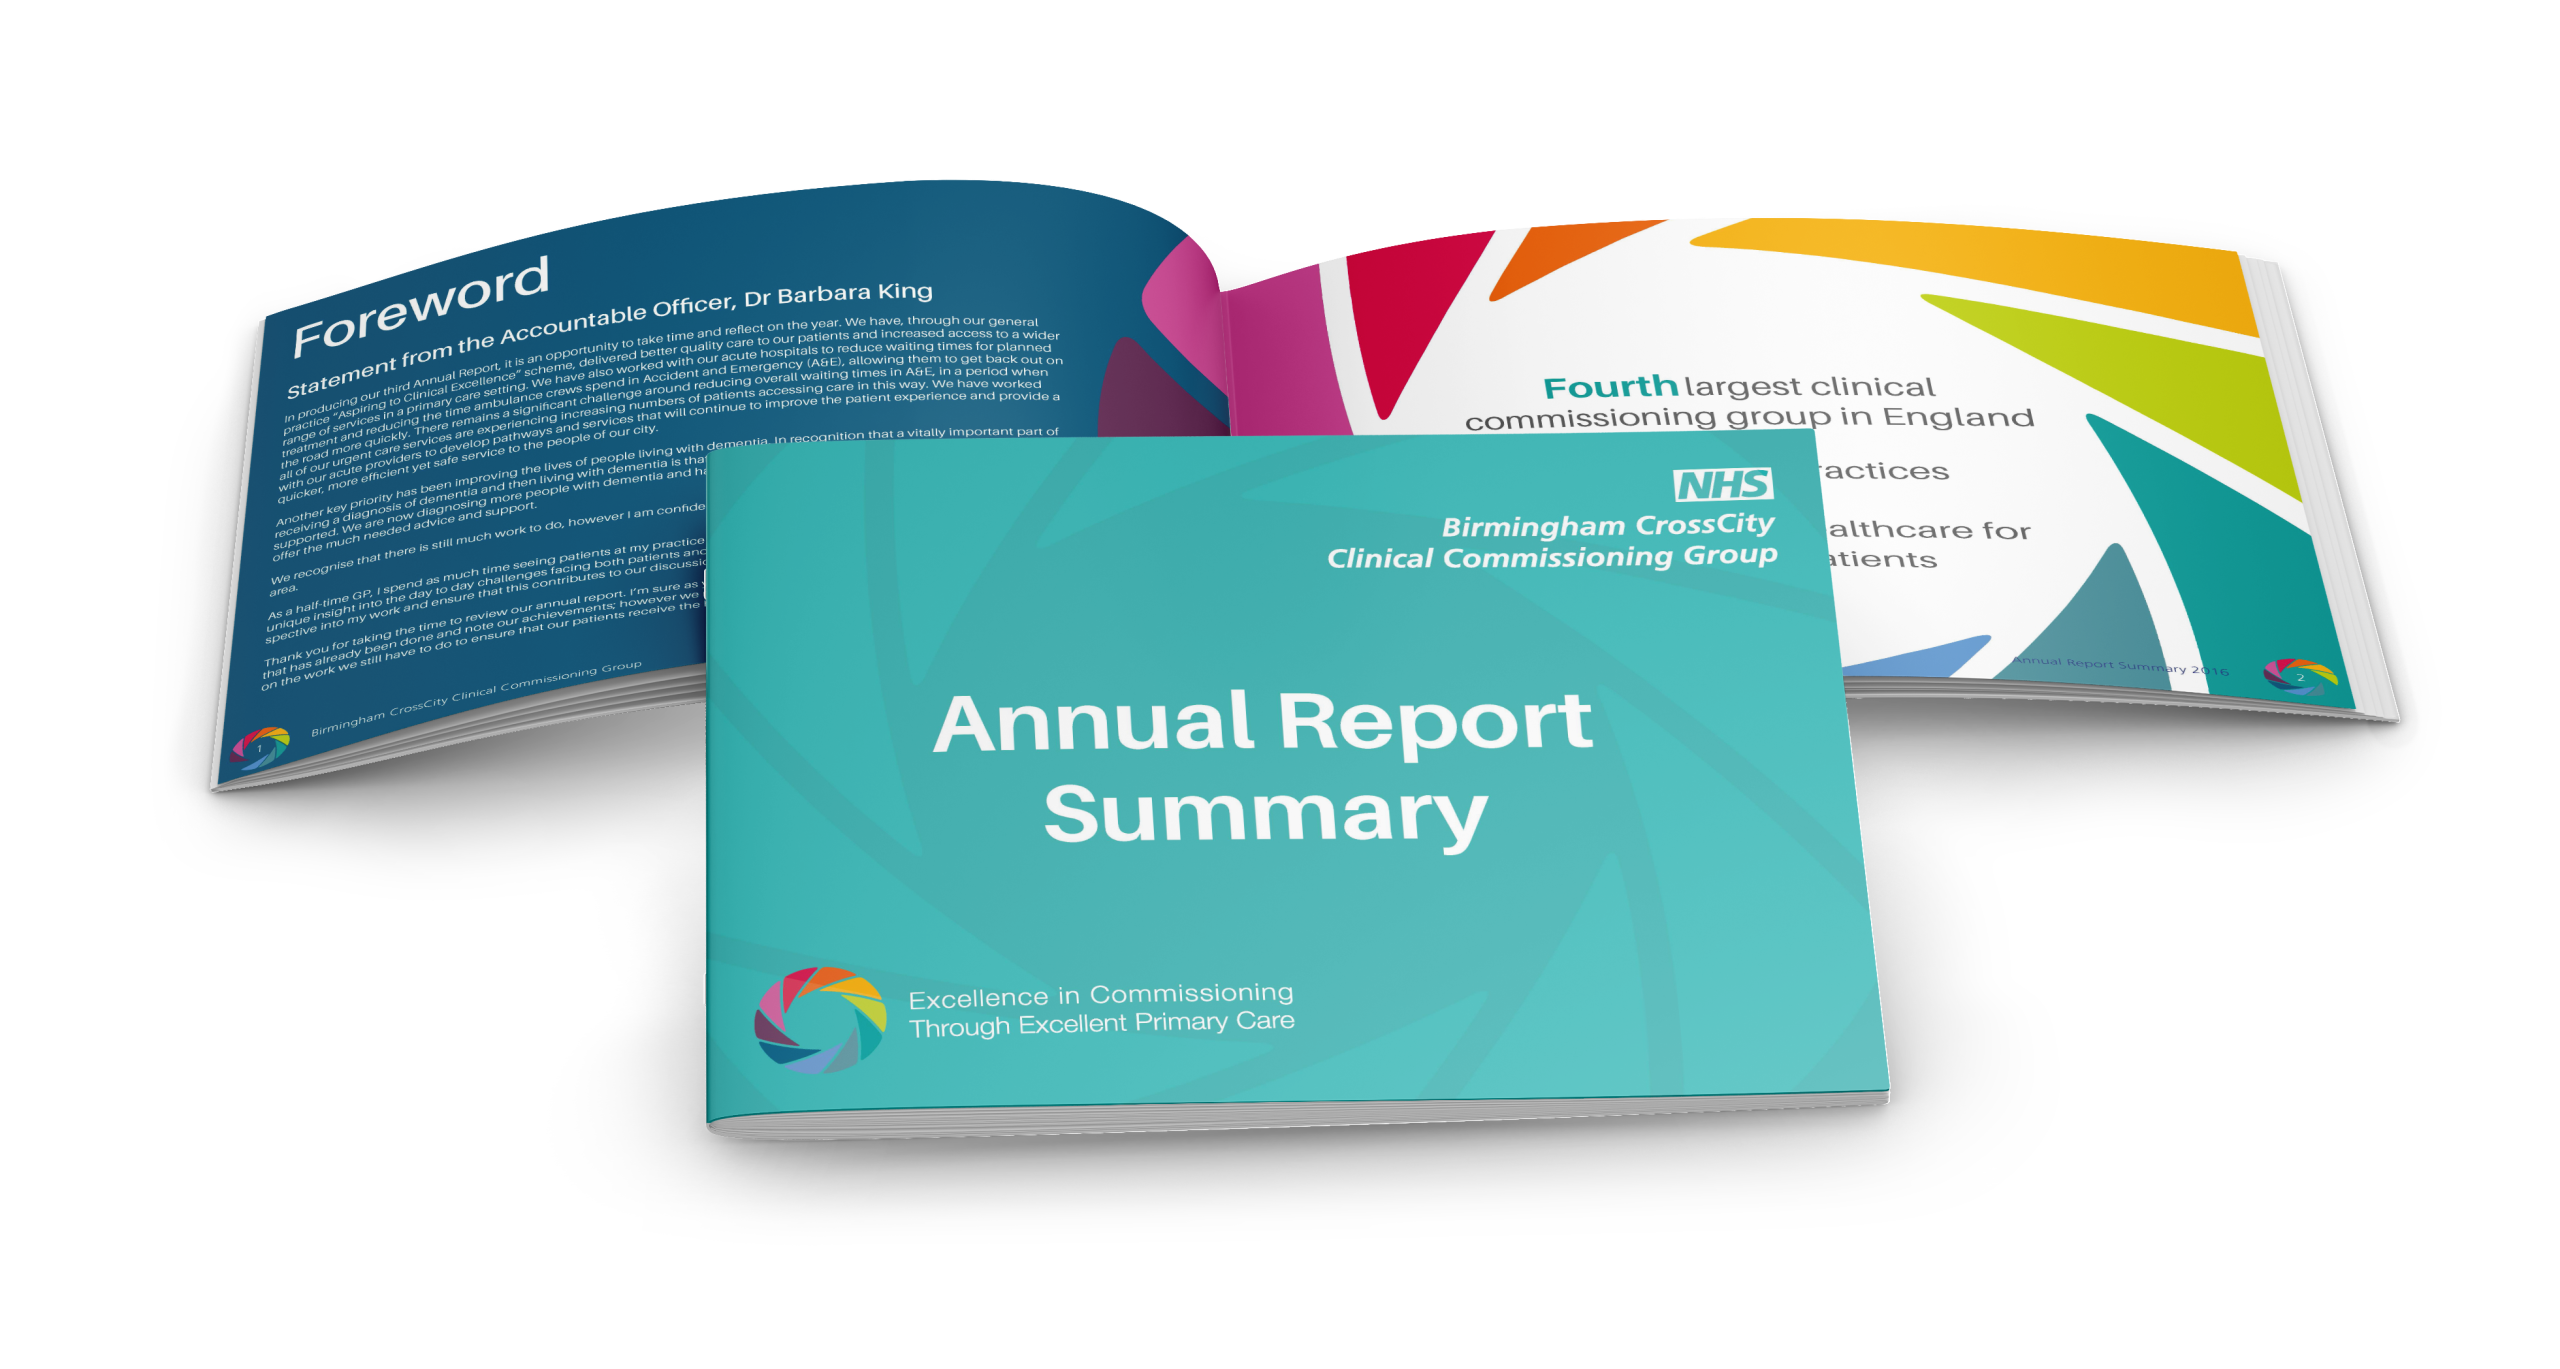
Led the creative development of an infographic-led annual report, taking a more visual and engaging approach to communicating the CCG’s achievements, priorities and impact. Developed a series of bespoke graphics and information-led layouts to simplify complex content, create a strong visual narrative and maintain consistency throughout the report.
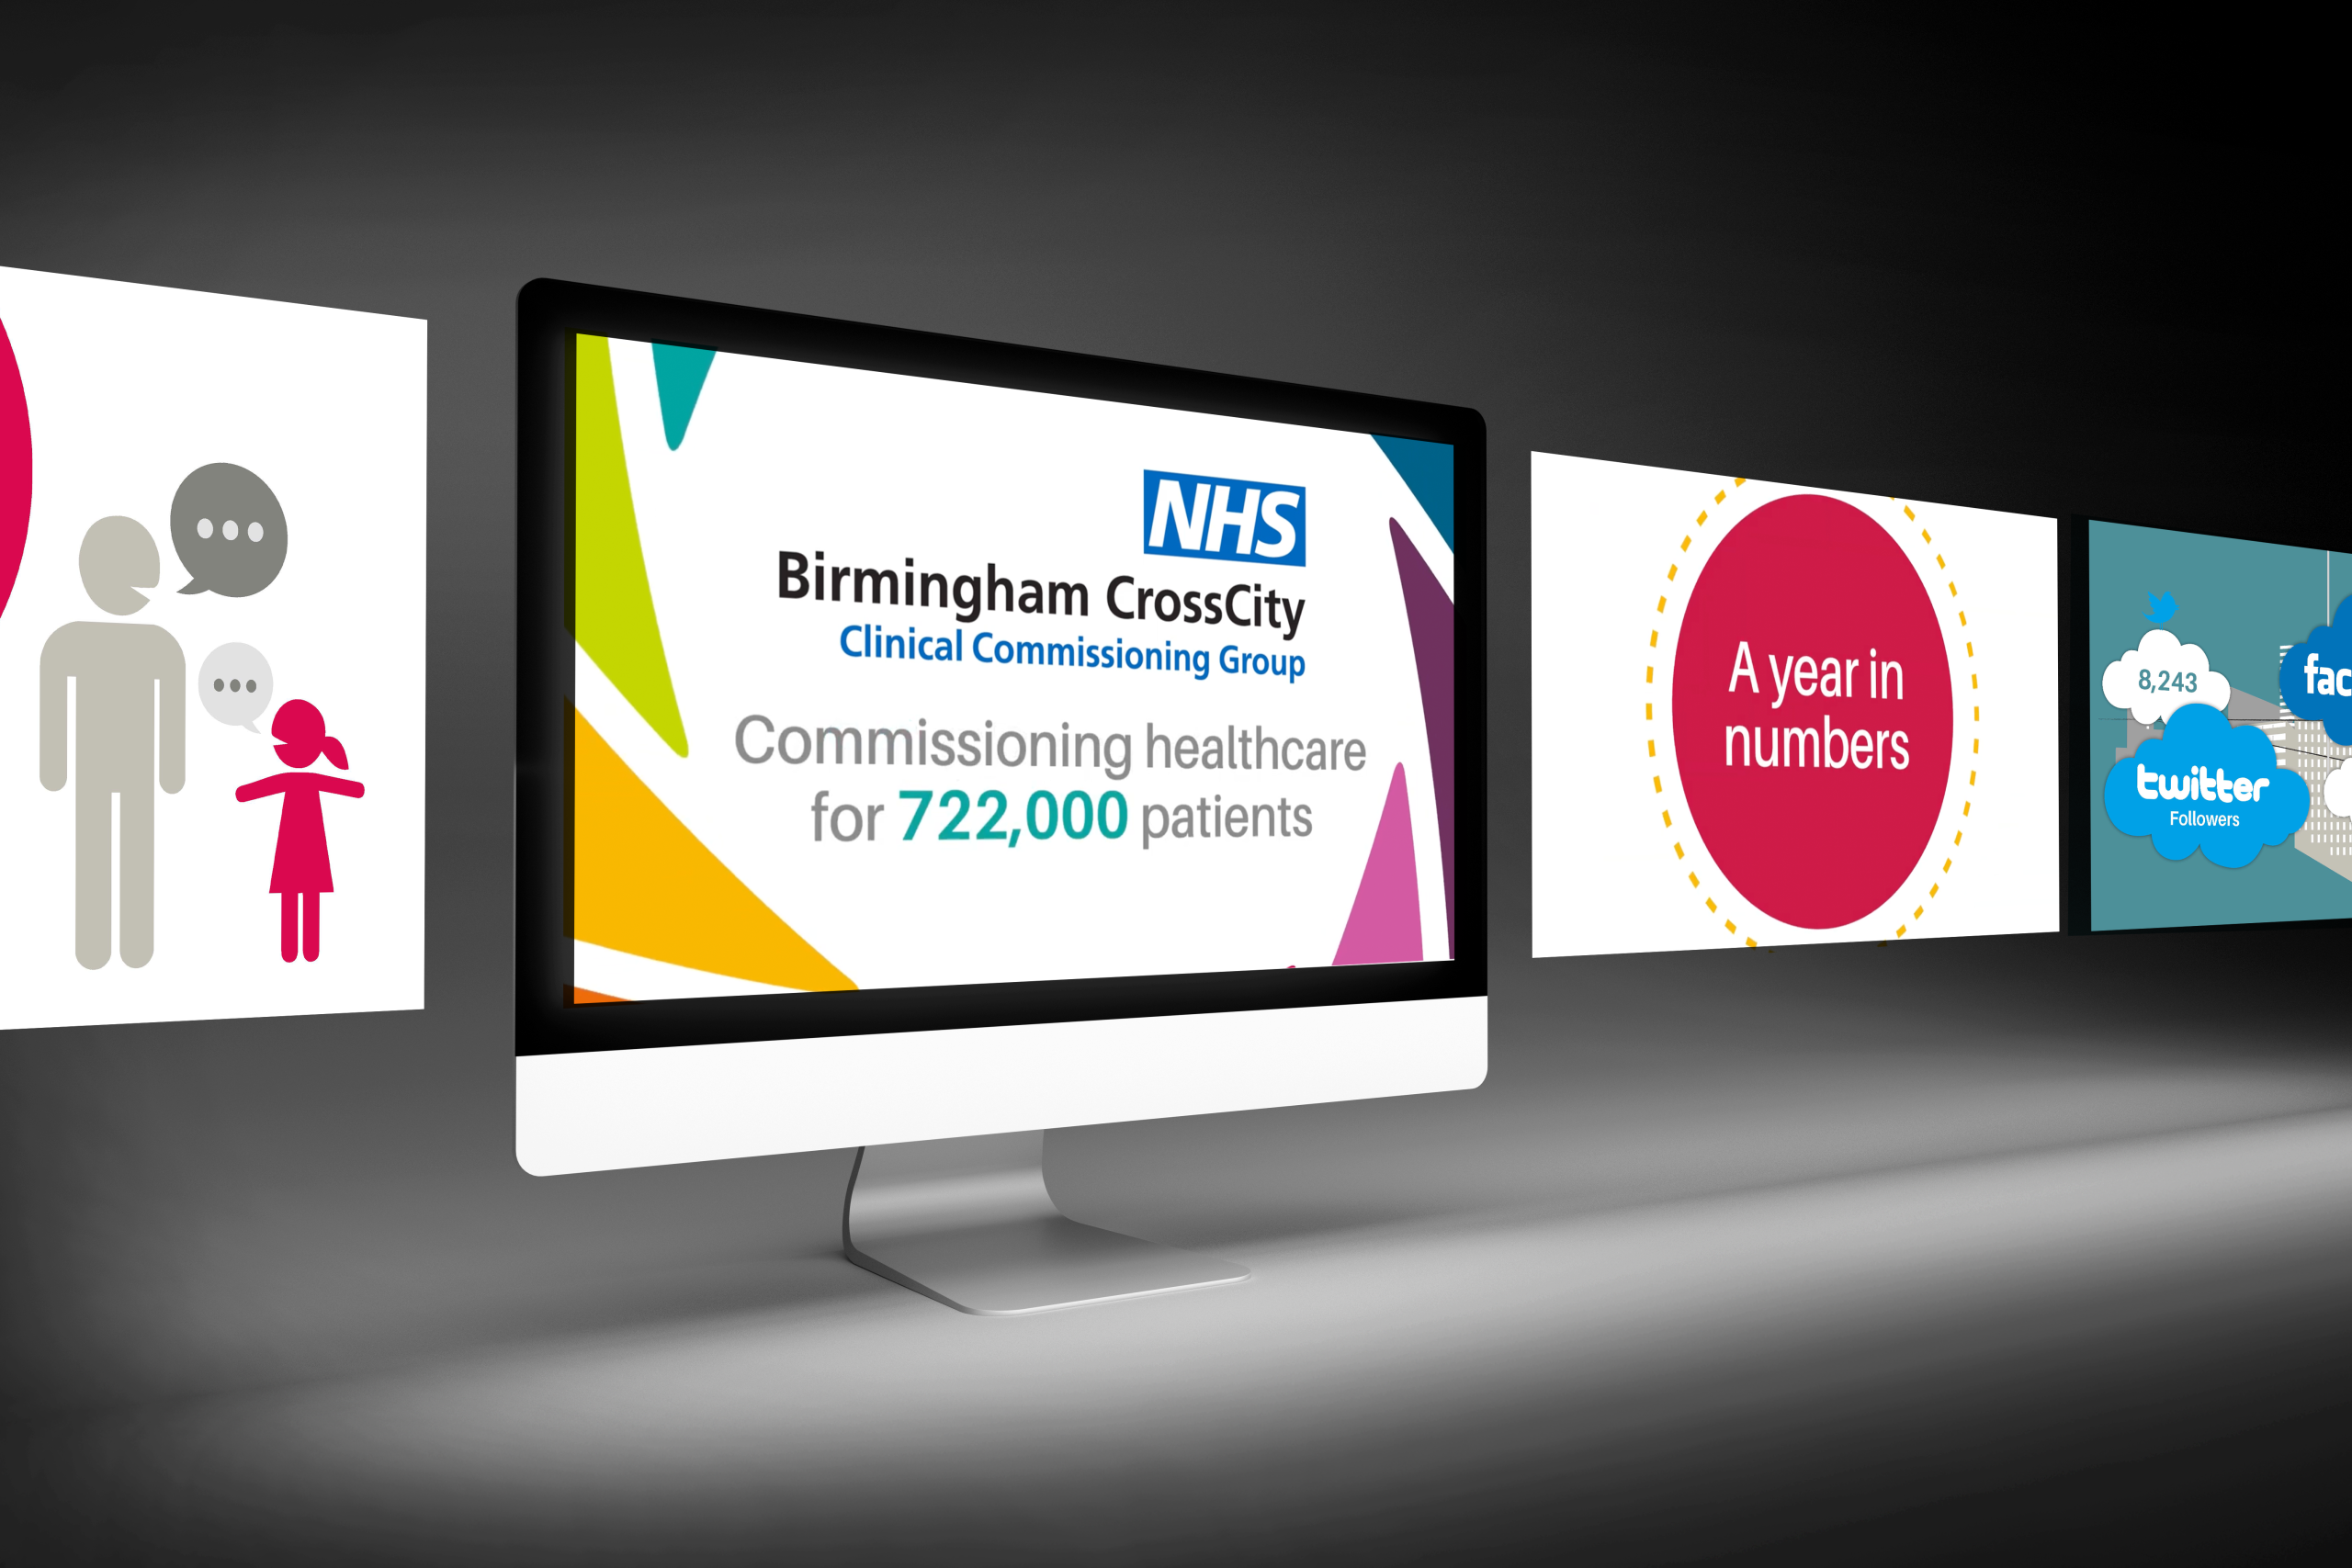
The visual language was also adapted into an animated version of the annual report, extending the content across digital channels and providing an engaging alternative way for audiences to access the key messages.
Overview
The project involved creating an annual report that moved away from a traditional editorial format, using infographics, visual storytelling and animation to communicate key information in a more accessible and engaging way.
Approach
The design focused on simplifying complex information and presenting it through a consistent visual system. Key elements included:
- Development of a distinctive infographic-led visual direction
- Creation of bespoke infographics to communicate achievements, priorities and outcomes
- Use of clear information hierarchy and visual storytelling to improve accessibility
- Design and artwork of the annual report
- Development of graphic assets for use in the animated version
- Adaptation of the report’s visual language into an animation
- Creation of a cohesive experience across print and digital formats
Impact
The infographic-led approach provided a more engaging way to communicate the CCG’s achievements and key messages, making complex information easier to navigate and understand. Extending the report into an animation helped broaden its reach and provided an additional digital format for sharing the organisation’s progress with stakeholders and local communities.